


Chart of accounts mapping aligns different account structures, whether from separate ERPs, acquired entities, or regional systems, to a single group chart so consolidated financials are consistent and auditable. You need it whenever more than one system feeds group reporting: multi-entity consolidation, post-acquisition integration, or an ERP migration. Map centrally, at the group level, rather than letting each entity improvise its own translation, or your consolidation will carry silent errors forward every close.
TL;DR:
- Mapping should be centrally managed at the group level to prevent silent errors and ensure consistency across all entities and systems.
- Use a mix of segment and account rules, with the hybrid approach being most maintainable, to translate local accounts into the group chart accurately.
- Regular validation of mappings, including unmapped account reports and intercompany reconciliation checks, is essential to maintain accuracy over time.
- Proper planning, ownership, and version control of the mapping table before implementation reduce rework and improve auditability.
- Automating import and validation processes, and utilizing tools with features like unmapped account alerts, can significantly decrease manual effort and improve close efficiency.
Table of Contents
- What is chart of accounts mapping? components and types
- How chart of accounts mapping works in practice
- Why mapping matters for consolidation and reporting
- Governance checklist: what to settle before you build mappings
- Step-by-step: how to map accounts for consolidation
- Testing, validation and keeping mappings accurate
- A simple mapping template and worked examples
- Tools and integration: what actually reduces the mapping workload
- Where automation actually removes mapping friction
- Sources
What is chart of accounts mapping? components and types
Mapping generally works at two levels: segment mapping, which translates individual pieces of an account code (cost centre, department, entity), and full-account or combination mapping, which translates the entire account string as one unit. Most groups need both, because segments behave predictably while full accounts sometimes need one-off treatment.
Layered on top is the rollup, a hierarchy that lets a group account absorb several detailed source accounts (three local “office supplies” lines, for instance, all rolling into one group line). Oracle’s documentation on segment rules and account rules sets out the underlying logic clearly:
- Segment rules map one segment value or range at a time, useful when only part of an account code needs translating.
- Account rules map the full combination, needed when the mapping isn’t a clean one-to-one segment swap.
- Rollup rules aggregate parent and child segment values into a single hierarchical view for reporting.
- A hybrid approach, segment rules for the routine 90%, account rules for exceptions, is usually the most maintainable choice.
How chart of accounts mapping works in practice
Mapping sits as a layer between your source ledgers and your group chart. It doesn’t rewrite the underlying transaction; it translates how that transaction appears when consolidated. This distinction matters for audit trails: a properly built mapping preserves statutory records at entity level while still producing a clean group view.
In practice, the flow tends to follow four stages:
- Extraction — trial balances are pulled from each source system, whether Xero, a legacy ERP, or a bespoke ledger.
- Translation — the mapping layer applies segment or account rules to convert each local code to its group equivalent.
- Posting or transfer — for consolidation tools built on a ledger architecture, mapped balances move from primary to secondary ledgers, or cross-ledger, without touching the original entries.
- Aggregation — rollup rules combine the translated balances into the group’s reporting structure.
Most teams load the mapping rules themselves using file-based import templates, CSV uploads, or an API connection, particularly when the mapping table runs into hundreds of rows. Oracle’s mapping page documentation describes exactly this pattern for loading rules at scale. Whichever method you choose, the local statutory ledger stays untouched. That separation is what lets a subsidiary file its own statutory accounts under local GAAP while the group still reports under IFRS or another framework, off the same underlying transactions.
Why mapping matters for consolidation and reporting
Get the mapping right and month-end starts looking almost boring: consistent line items across entities, faster intercompany eliminations, and a group P&L that doesn’t need forensic reconciliation before it goes to the board. Get it wrong and the same three problems resurface every quarter.
- Unmapped accounts — a new local account gets created, nobody adds the mapping rule, and its balance simply vanishes from the group view or lands in a suspense line.
- Mismatched granularity — one entity tracks five expense types where the group chart has one, so the rollup either loses detail or forces awkward manual splits.
- Local changes going unrecorded — a subsidiary restructures its chart, and the mapping table isn’t updated to match.
- FX and timing issues — balances translate at the wrong rate or period, distorting the consolidated figures.
A unified group chart with enforced intercompany matching removes most of this friction. Practitioner guidance on multi-entity consolidation puts the improvement at 70 to 80 percent fewer consolidation issues once a standard chart and consistent intercompany coding are in place, and intercompany elimination errors remain one of the most common audit findings in group accounts.
Governance checklist: what to settle before you build mappings
Build the mapping table before the governance is settled and you’ll rebuild it twice. Sort out ownership and scope first.
Decide the group chart’s granularity early. A lean group chart of 60 to 150 accounts tends to stay analytically useful without becoming unmanageable, whereas anything with a mapping table into the thousands of rows becomes near impossible to audit by eye.
- Define the group chart of accounts and its intended level of detail before mapping a single line.
- Hold mappings in one central repository, not spreadsheets scattered across entity finance teams.
- Put change control around it: who can add or amend a mapping rule, and when.
- Make intercompany coding a mandatory field on every relevant account, not an optional tag.
- Set a documented audit cadence, monthly or quarterly, for revalidating mappings against live trial balances.
Treating intercompany coding as a first-class field rather than an afterthought lets automated eliminations catch mismatched counterparties early, which is exactly where audit queries tend to start.
Pro Tip: Pilot the mapping on one entity across three reporting months before rolling it out group-wide. It surfaces the exceptions, the odd local account, the one-off cost centre, before they become a group-wide fire drill.
Step-by-step: how to map accounts for consolidation
- Export source chart of accounts and trial balances from every entity system feeding the consolidation, including any legacy or bolt-on ledgers.
- Design the group chart of accounts, deciding structure and granularity before you touch a single mapping row.
- Populate the mapping table row by row, using segment rules for routine translations and account rules for the exceptions that don’t fit a clean pattern.
- Load the mappings into a staging environment via import templates or an API connection rather than the live consolidation.
- Run sample-period reconciliations against at least one full quarter of real trial balances, and fix every exception before moving on.
- Document every mapping decision, especially the judgement calls on one-off accounts, so the next person doesn’t have to guess why a rule exists.
- Plan the cutover, deciding whether prior periods need retrospective mapping (backfilling) or whether the mapping applies from a clean go-forward date only.
Backfilling is the step teams underestimate. If the board wants comparable prior-year figures under the new group structure, budget real time for it, it’s rarely a quick export-and-apply job.
Testing, validation and keeping mappings accurate
A mapping table is never really “finished”. Charts change, entities restructure, and new accounts get created without anyone remembering to map them.
- Run unmapped-account reports after every period close, catching new local accounts before they distort the consolidation.
- Check balances per entity against source trial balances to confirm nothing was lost or duplicated in translation.
- Test intercompany eliminations specifically, since mismatched counterparty coding is where most reconciliation breaks surface.
- Run FX and retranslation checks where entities report in different currencies, an area covered in more depth in Zenith-books’s guide to multi currency reconciliation.
- Keep an audit trail with effective dates, so a mapping change doesn’t retroactively alter a period that’s already closed.
Datasights’ consolidation guidance is blunt about this: unmapped-account alerts and reconciliation checks aren’t optional extras, they’re what stops a heterogeneous set of source systems from quietly corrupting the group numbers. Set a revalidation cadence, monthly for high-change groups, quarterly otherwise, and stick to it.
A simple mapping template and worked examples
Picture a subsidiary on a four-digit local chart (say, account 4210 for “office supplies, EU region”) rolling up into a three-digit group account (410, “administrative expenses”). That’s a straightforward segment rule. Now picture three separate local accounts, one per region, all needing to land on that same group line, that’s a hierarchical rollup.
Whatever tool holds your mapping table, structure it with these columns:
- Source ID and source name — the local account code and its description.
- Target ID — the group account it maps to.
- Rule type — segment, account, or rollup.
- Effective date — when the mapping starts (and ends, if superseded).
- Owner — who’s accountable for that row.
- Notes — why a one-off treatment exists, spelled out rather than assumed.
Tools and integration: what actually reduces the mapping workload
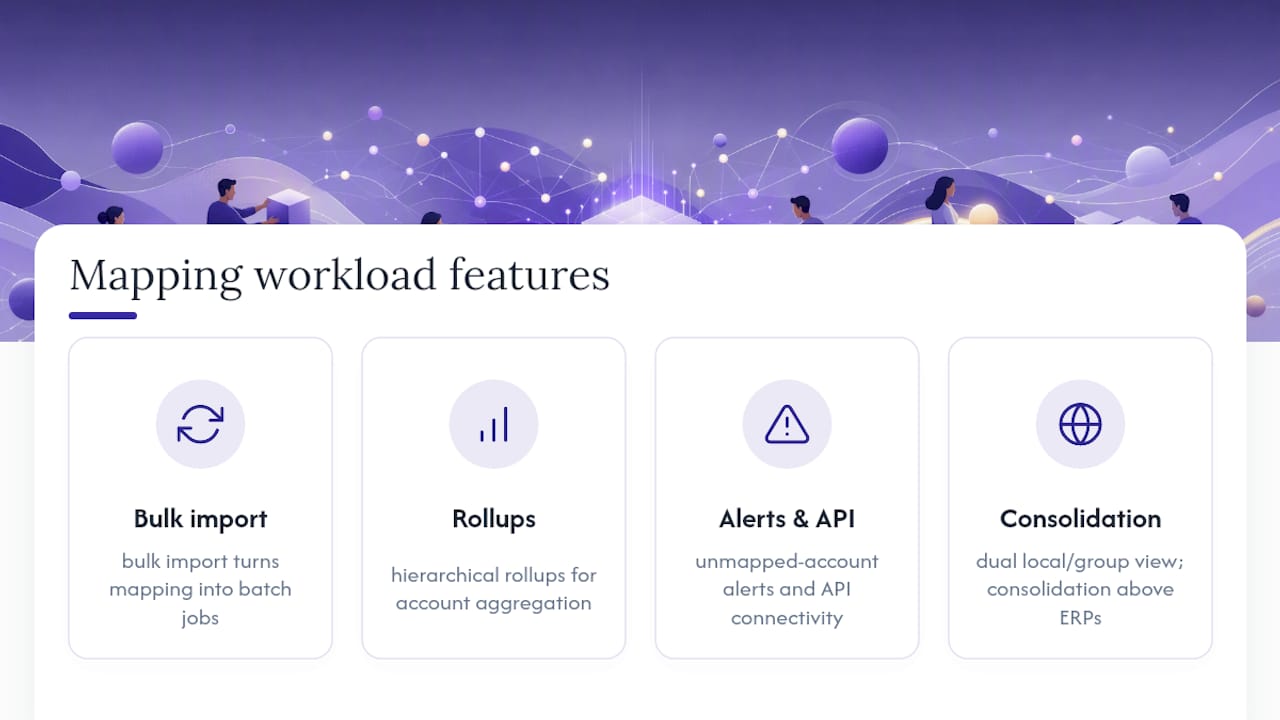
Look for bulk import, hierarchical rollups, unmapped-account alerts, and API connectivity, features that turn a mapping table from a manual chore into something that mostly runs itself. A dual view, seeing both the local statutory account and the group-mapped account side by side, is particularly useful for finance teams who need to sanity-check a local figure without leaving the reporting layer, a pattern Emfino’s guide to group chart design recommends for exactly this reason. Where entities span genuinely different ERPs, a dedicated consolidation layer sitting above them usually beats forcing everyone onto one system.
Where automation actually removes mapping friction
Most of the pain in chart of accounts mapping isn’t the logic, it’s the repetitive manual work of chasing unmapped accounts and re-keying trial balances every close. Zenith-books’ invoice-to-Drive automation and bank data syncing exist to strip that repetition out at source, so the mapping table reflects clean data rather than data someone retyped at 11pm before the board pack was due. Some clients report zero manual entry across transactions and shorter month-end closes as a direct result. A partner resource worth reading alongside this is Gozera’s guide to digital transformation for accounting firms, which covers the wider shift finance teams are making toward automated workflows. Explore Zenith-books’ full solution set if reconciliation and reporting still eat more of your close than they should.
— Gašper
Sources
- Segment rules and account rules for chart of accounts mapping — Oracle
- Chart Of Accounts Mapping — insightsoftware
- Multi-entity consolidation guide — Onetribe
- Global financial consolidation guide — Datasights