


You can have a working finance dashboard in Google Sheets in under a few hours. Grab a free template and you’re done in under an hour. Build your own two-sheet setup with SUMIFS and pivot tables, which may take a few hours. Want live bank data flowing in automatically? That’s where automation tools like Zenith-books come in, and setup runs longer but ongoing maintenance drops to near zero.
The three paths, in plain terms:
- Grab a template: fastest route, minimal formula knowledge required, works well for personal budgets and simple business tracking
- Build from scratch: full control over categories, formulas, and layout; best if you want to understand every calculation
- Automate with live sync: connects your bank accounts directly to Sheets; best for small business owners who need accurate, always-current numbers without weekly CSV exports
Key Takeaways
A working Google Sheets finance dashboard is achievable in under two hours with a free template, or in a single afternoon if you build it yourself using a three-tier architecture with SUMIFS, QUERY, and pivot tables.
| Point | Details |
|---|---|
| Start with a free template | Finsemble or Vertex42 get you a working dashboard in under 60 minutes with no formula knowledge required. |
| Use three-tier architecture | Keep raw transactions, calculations, and the dashboard on separate tabs to prevent formula breakage. |
| Prioritize data hygiene | Inconsistent category names break SUMIFS silently; use a mapping column or dropdown validation on the Transactions tab. |
| Automate for reliability | Live bank sync via Zenith-books removes weekly CSV exports and keeps dashboard numbers current automatically. |
| Secure before connecting | Review OAuth scopes, enable 2FA on your Google account, and keep a monthly offline backup of your Transactions tab. |
Table of Contents
- What’s the best finance dashboard in Google Sheets?
- Should you use a template or build your own dashboard?
- How do you build a finance dashboard in Google Sheets from scratch?
- How do you get bank and invoice data into Google Sheets?
- Which formulas and charts make a finance dashboard actually useful?
- What should you check before connecting bank data or installing add-ons?
- The part most guides skip about building a finance dashboard
- Live bank data in your Google Sheets dashboard, without the manual work
- Sources
What’s the best finance dashboard in Google Sheets?
Ready-made templates save hours. Here’s where to find the best ones, split by what you’ll pay.
Free templates
Google Sheets Template Gallery ships with a built-in budget template accessible directly from File > New > From template gallery. It’s basic, but it’s already in your account and requires zero setup. Good for personal monthly budgets.
Finsemble’s personal finance template is a free download that covers KPIs, a transactions tab organized by account, budget vs. actual across 17 spending categories, balance history, savings goals, and alerts. It also supports optional bank feed connections for automatic daily updates. For a free template, the feature set is unusually complete.
Vertex42 offers a library of Google Sheets finance templates, including budget planners, cash flow trackers, and net worth calculators. Most are free with optional paid upgrades. Strong documentation and widely used in the U.S.
One-time paid templates
Abby Organizes — Complete Finance Dashboard and Annual Budget System is a one-time purchase available on Etsy. It combines a full annual budget, expense tracker, and visual dashboard in a single file. Buyers consistently cite the layout clarity and the included setup instructions. Best for individuals or households who want a polished, done-for-you design without a recurring fee.
Subscription-based options
Add-ons and connector tools (available through the Google Workspace Marketplace) can link your bank accounts or accounting software to Sheets on a recurring subscription. These vary widely in price and data permissions, so review OAuth scopes carefully before installing any. The MakeUseOf DIY guide is a useful reference if you want to understand what a connector actually does to your spreadsheet before trusting one with your bank login.
Should you use a template or build your own dashboard?
The honest answer depends on two things: how much you want to customize, and whether you need live data.
Using a ready-made template gets you running in 30–60 minutes. The trade-off is that someone else’s category structure may not match yours, and editing formulas you didn’t write can get confusing fast. Templates also vary in quality. A well-built free template like Finsemble’s is genuinely useful. A poorly structured one will waste more time than building from scratch.
Building your own takes 2–6 hours for a clean setup with custom formulas and charts. The upside is total transparency. You know exactly what every formula does because you wrote it. The MakeUseOf approach of using just two sheets (Transactions + Dashboard) with pivot tables and slicers is a practical starting point that keeps things manageable.
Full automation (live bank sync, automatic categorization) takes longer to configure but pays off over months of use. If you’re running a small business and manually exporting CSVs every week, that time adds up fast.
Quick decision rule: if you need live bank data and low ongoing maintenance, go the automation route. If you want full control and are comfortable with formulas, build it. If you just need something working today, grab the Finsemble template.
Pro Tip: Before you customize any downloaded template, make a copy first (File > Make a copy). Work in the copy, not the original. If something breaks, you can always go back.
How do you build a finance dashboard in Google Sheets from scratch?
The cleanest architecture uses three tiers: a raw transactions tab, one or more transformation tabs, and a presentation/dashboard tab. Never mix raw data with charts on the same sheet. MageSheet’s three-tier BI architecture makes this point clearly: keeping layers separate is what makes dashboards stable and maintainable.
Step-by-step build
-
Create a Transactions tab. Columns: Date, Description, Category, Amount, Account. Add a dropdown validation list for Category so entries stay consistent. This is your raw data layer. Never put formulas or charts here.
-
Add a Categories tab. List every spending and income category. This becomes the reference list for your dropdowns and SUMIFS formulas.
-
Create a Calculations tab (hidden). This is where aggregation happens. Use SUMIFS to total spending by category and month:
=SUMIFS(Transactions!C:C, Transactions!B:B, A2, Transactions!A:A, ">="&DATE(year,month,1), Transactions!A:A, "<"&DATE(year,month+1,1))Use ARRAYFORMULA to auto-populate helper columns (like extracting the month from a date):
=ARRAYFORMULA(IF(Transactions!A2:A<>"", TEXT(Transactions!A2:A,"YYYY-MM"), ""))Use QUERY for flexible aggregations:
=QUERY(Transactions!A:D, "SELECT B, SUM(C) WHERE A IS NOT NULL GROUP BY B ORDER BY SUM(C) DESC", 1) -
Build pivot tables. Insert > Pivot table, source the Transactions tab. Add slicers for date range and category. Per the MakeUseOf guide, hiding pivot tables inside the dashboard sheet (rather than on a separate tab) keeps slicer functionality intact while keeping the layout clean.
-
Create the Dashboard tab. Pull summary numbers from the Calculations tab using simple cell references. Add charts directly from pivot table data. Keep this tab display-only.
-
Add charts. Column chart for monthly cash flow, stacked bar for budget vs. actual, line chart for running balance, donut chart for category share.
Pro Tip: Lock the Transactions tab with sheet protection (right-click tab > Protect sheet) so collaborators can’t accidentally overwrite raw data. Give edit access only to the input form or a separate data-entry tab.
Common formula errors
| Error | Likely cause | Fix |
|---|---|---|
| #REF! | A referenced range was deleted or moved | Recheck the source range in the formula bar |
| #VALUE! | Date column stored as text, not a date | Format the column as Date (Format > Number > Date) |
| SUMIFS returns — | Category text doesn’t match exactly | Check for trailing spaces; use TRIM() on the category column |
| ARRAYFORMULA not expanding | Formula placed in a cell that already has data below it | Clear the cells below before entering the ARRAYFORMULA |
How do you get bank and invoice data into Google Sheets?
Getting data in is where most dashboards either work well or fall apart. There are four main methods, each with different trade-offs.
Manual CSV export is the simplest. Download a transaction file from your bank’s website, paste it into the Transactions tab. Takes 5–10 minutes per account per month. Fine for personal use; tedious for a business with multiple accounts.
IMPORTRANGE pulls data from another Google Sheet. Useful if you maintain a separate data-entry sheet or if a team member logs expenses elsewhere. Syntax: =IMPORTRANGE("spreadsheet_url", "Sheet1!A:D"). Note that IMPORTRANGE requires you to authorize the connection once and doesn’t pull from external sources like banks.
Add-ons and connectors (Google Workspace Marketplace) can link accounting software or bank APIs to Sheets. Quality varies. Before installing any add-on, check the OAuth permissions it requests. An add-on that asks for full Drive access to pull bank transactions is asking for more than it needs.
Live sync tools connect your bank accounts once and push transactions into Sheets automatically. A live dashboard that fetches current data on load removes the manual export step entirely. This is the approach that makes sense for small business owners who check their dashboard weekly or more often.
Zenith-books’s bank-to-Sheets sync works this way: connect your accounts, and transactions flow into your spreadsheet automatically, with categorization applied. No CSV, no copy-paste, no weekly ritual.
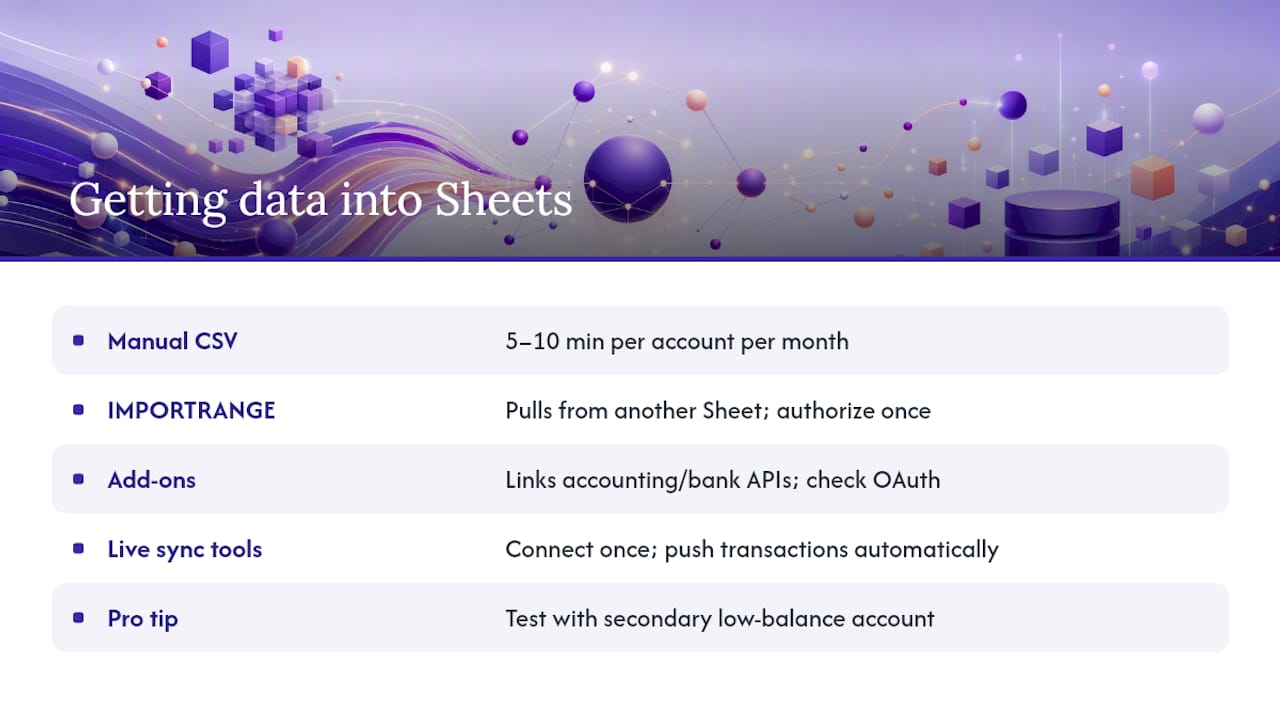
Pro Tip: Before connecting any bank account to a third-party tool, test with a secondary or low-balance account first. Validate that the fields (date, description, amount, account) map correctly to your Transactions tab before pointing it at your primary accounts.
Security checklist before connecting accounts
- Review every OAuth scope the add-on or tool requests; reject anything that asks for write access to your entire Drive
- Prefer read-only bank connections where the vendor supports them
- Read the vendor’s privacy policy for data storage and retention terms
- Enable two-factor authentication on your Google account before connecting any financial data
- Check whether the tool stores your data on its own servers or only passes it through
- Use SurveyCTO’s guidance on sharing and publishing dashboards when distributing read-only views to stakeholders
Google Sheets has a hard ceiling of 10 million cells per spreadsheet, and practical performance often degrades around 500,000 rows. For most personal and small-business dashboards, that limit is nowhere near a concern. If you’re aggregating years of transaction data across many accounts, consider moving heavy aggregation to BigQuery and using Connected Sheets for the presentation layer.
Which formulas and charts make a finance dashboard actually useful?
The formulas below cover the five KPIs that matter most for personal and small-business dashboards. For a broader view of which metrics to prioritize, the financial KPI guide from LedgerOne CFO maps these directly to small-business priorities.
| KPI | Formula approach | Chart type |
|---|---|---|
| Monthly net cash flow | SUMIFS by date range and income/expense type | Column chart, one bar per month |
| Budget vs. actual | SUMIFS against a budget reference table | Stacked bar, budget vs. actual side by side |
| Net worth / balance | SUM of account balances from a balances tab | Single KPI card or line chart over time |
| Spending by category | QUERY with GROUP BY category | Donut chart |
| Running balance | ARRAYFORMULA + cumulative SUMIF | Line chart |
Pivot tables with slicers add interactivity without requiring complex formulas. A date slicer lets you filter the entire dashboard to a specific month or quarter. A category slicer narrows every chart simultaneously. Per the MakeUseOf guide, placing pivot tables on the same sheet as your dashboard (but hidden in unused rows or columns) keeps slicers connected to your charts.
For mobile-friendly layouts, keep KPI cards in the top two rows of the Dashboard tab. Use sparklines (=SPARKLINE(range)) inside cells for compact trend indicators that don’t require a full chart. Freeze the top rows so KPIs stay visible when scrolling. Avoid merged cells in the data area; they break ARRAYFORMULA and QUERY.
What should you check before connecting bank data or installing add-ons?
The security checklist above covers the core steps. A few additional points worth calling out:
- Sharing dashboards with stakeholders: use File > Share > Anyone with the link (Viewer only) for read-only access. For investors or board members, export a PDF snapshot (File > Download > PDF) so the underlying data stays private.
- Version history: Google Sheets keeps a full version history (File > Version history > See version history). This is your audit trail. For an extra layer of protection, keep a monthly export of your raw Transactions tab in a locked Drive folder or offline backup.
- Data ownership: with any third-party connector, confirm in writing (or in the terms of service) that you own your data and can export or delete it at any time.
Pro Tip: Set a monthly calendar reminder to export your Transactions tab as a CSV to a local folder. Cloud sync is reliable, but a local copy costs nothing and has saved more than a few people from accidental deletion.
The part most guides skip about building a finance dashboard
The visual design of a dashboard is almost never the problem. The problem is almost always the data behind it.
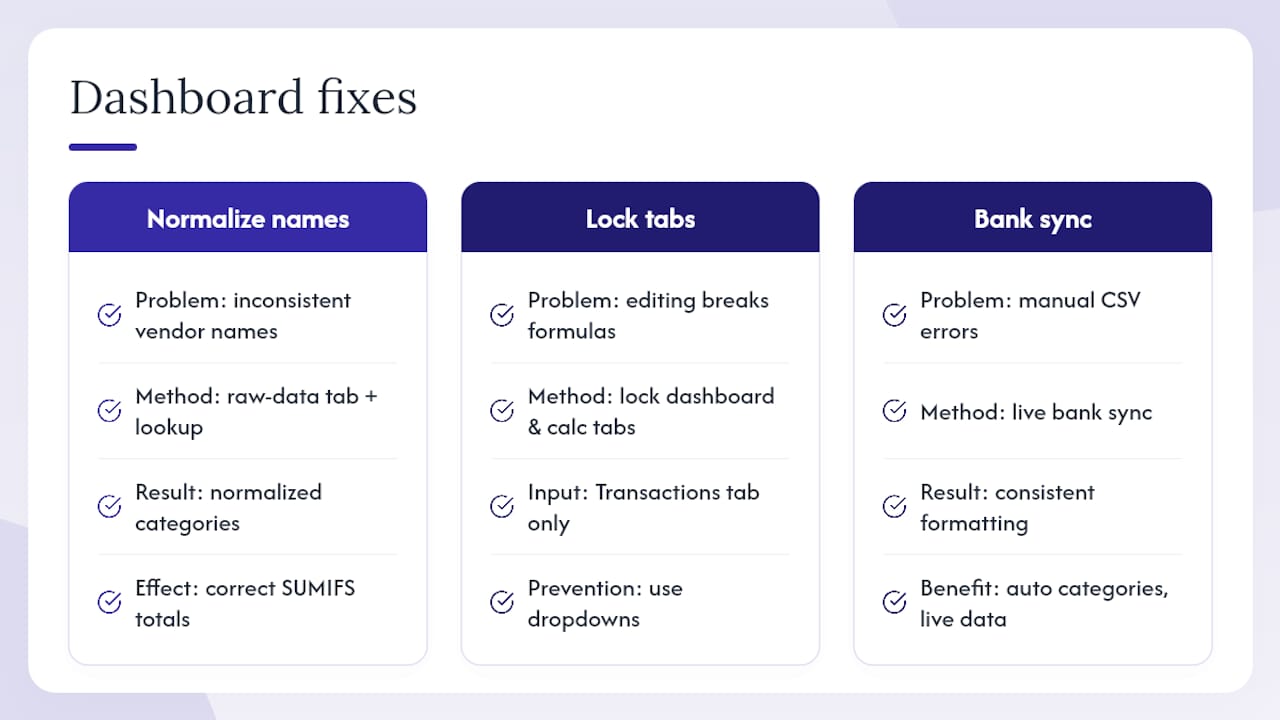
Inconsistent category names are the most common failure point. If your bank exports “AMAZON.COM” one month and “Amazon Marketplace” the next, your SUMIFS formula treats them as two different vendors. Your category totals are wrong, and you won’t notice until you’re staring at a number that doesn’t make sense. The fix is a dedicated raw-data tab with a lookup or mapping column that normalizes vendor names before they reach any formula. This is the architecture the MakeUseOf guide describes, and it’s the single most important structural decision you’ll make.
The second failure point is treating the dashboard tab as a data-entry tab. Once someone types a number directly into a cell that’s supposed to hold a formula, the whole calculation chain breaks silently. Lock the dashboard tab. Lock the calculations tab. The only place anyone should type is the Transactions tab, and even there, dropdowns reduce errors significantly.
For small businesses that want reliable numbers without the weekly maintenance, a live bank sync removes both problems at once. Transactions come in with consistent formatting, categories get applied automatically, and the dashboard reflects current data without anyone touching a CSV. That’s not a luxury feature. For a business owner checking cash flow before a vendor payment, it’s the difference between a dashboard you trust and one you’re always second-guessing.
Live bank data in your Google Sheets dashboard, without the manual work
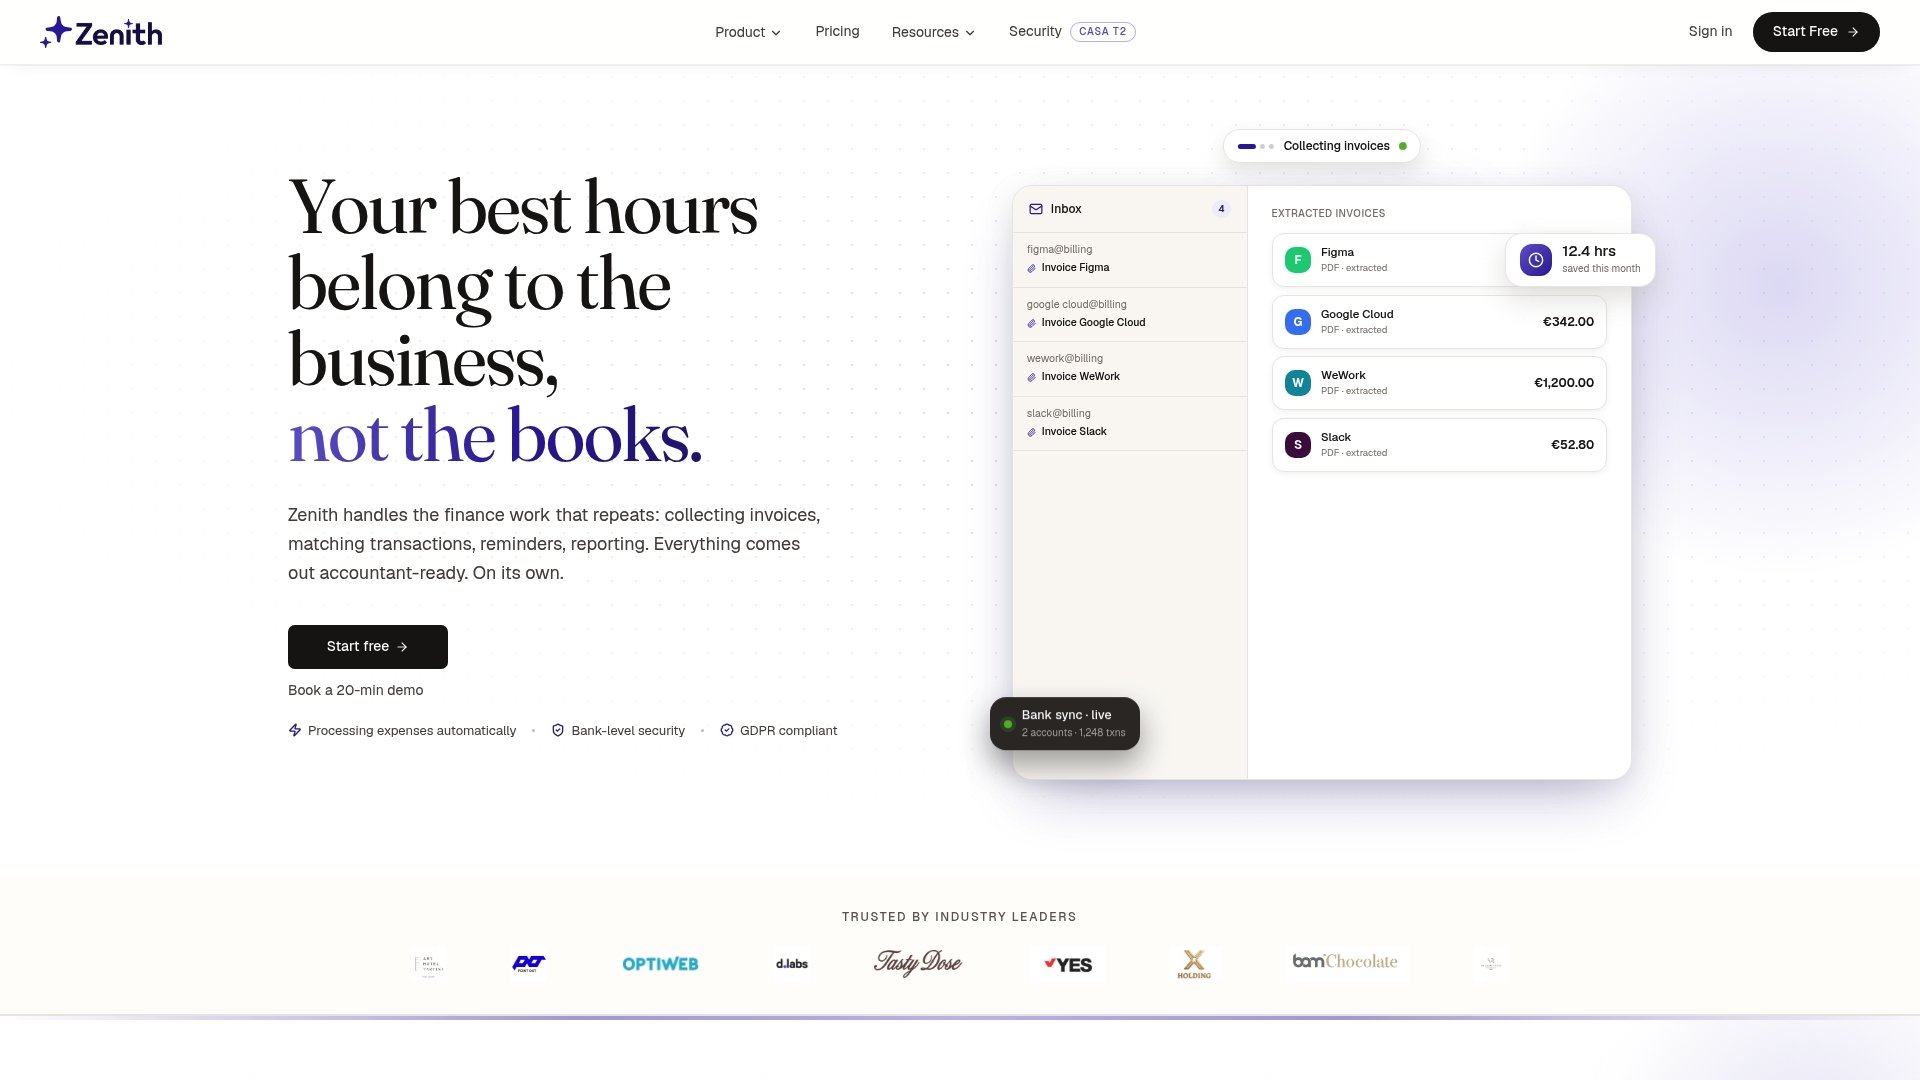
Manual CSV exports work until they don’t. Miss one week, and your cash flow chart is lying to you. Zenith-books solves this with a live bank-to-Sheets sync that pushes transactions directly into your spreadsheet as they happen, with automatic categorization already applied.
Here’s what Zenith-books automates for you:
- Bank transactions sync to Google Sheets in near real time, no CSV required
- Invoices extracted from email and auto-filed to Google Drive
- Transactions matched and categorized automatically
- Invoice data flows into your dashboard without manual entry
- Full audit trail maintained for every transaction
The lowest-friction way to test it: connect a single bank account, let it run for a week, and check whether the fields map cleanly to your existing Transactions tab. If they do, you’ve just eliminated your biggest maintenance task. Start with Zenith-books’s finance automation workflows and see how much of your bookkeeping routine disappears.
Sources
- I built a personal finance dashboard in Google Sheets that beats any app
- Turning Google Sheets into a Real-Time Business Intelligence Dashboard | MageSheet
- Live Google Sheets Dashboards: Always Current, Never Re-upload | VibeFactory
- Dynamic Real-Time Dashboards in Google Sheets - SurveyCTO
- Personal Finance Google Sheets Template, Free Download | Finsemble