


Finance automation pays for itself fastest in high-volume, transactional work, as outlined in this invoice processing outsourcing guide. Invoice processing, cash application, and bank reconciliation typically return their cost within a few months to about a year once you’re running at scale, according to benchmarks from the Hackett Group. Order-to-cash process costs can fall by 52–59% with process-led AI transformation, and staffing requirements can decline by 56–64% per $1 billion in revenue. Those are ceiling figures from mature deployments, not what you should pencil in for month one.
Before you build a business case, do two things:
- Record your baseline now — cost per invoice, cycle times, error rates, and days sales outstanding (DSO), before a single workflow changes.
- Pick a high-volume pilot — accounts payable or cash application, where transaction counts are large enough to produce a measurable, defensible result within two quarters.
Statistic to know: mature AI adopters in Hackett’s benchmarked cohort achieved 25% lower invoice processing costs and 33% shorter budget cycles. Treat that as the top end of what’s achievable, not the number you present to your board on day one.
Key Takeaways
Finance automation delivers measurable ROI fastest in high-volume transactional processes when baselined properly and costed on a fully-loaded basis.
| Point | Details |
|---|---|
| Start with transactional work | Invoice processing and cash application pay back in 6 to 12 months; FP&A gains take longer. |
| Baseline before you build anything | Record cost per invoice, cycle time, error rate, and DSO before deployment starts. |
| Cost the full picture | Include integration, data remediation, and change management, often 2 to 3 times the licence fee. |
| Use conservative scenarios | Apply 60–80% realisation rates against benchmark ceilings, not the full percentage. |
| Pilot with Zenith-books | AP and cash-application automation with AI invoice extraction and bank sync suits a first measurable pilot. |
Table of Contents
- Why finance automation accelerates ROI
- How to calculate ROI for finance automation
- What ROI metrics and benchmarks should you cite?
- Why do finance automation projects fall short of their promised ROI?
- How does automation affect risk management and compliance costs?
- What strategic value does automation deliver beyond cost savings?
- How do you measure intangible benefits like error reduction and staff satisfaction?
- Does ERP integration change how fast you see ROI?
- What the ROI conversation gets wrong
- How Zenith-books can help you build the case
- Sources
Why finance automation accelerates ROI
The mechanism is simpler than most vendor decks make it sound. Automation removes manual touches from a transaction, and every touch removed cuts labour cost, shortens cycle time, and reduces the chance of a human error that needs rework later. An invoice that used to pass through three people for keying, coding, and approval now needs one person to review an exception. That’s the entire value chain in miniature.
The bigger gains show up when automation runs across a whole process rather than in isolated pockets. A single automated step, invoice capture, say, saves time locally but leaves the bottleneck downstream untouched. Applied end-to-end across order-to-cash (capture, matching, approval, payment, cash application, reconciliation), the effects compound: fewer exceptions at each stage mean fewer people needed to chase them at the next. This is precisely the distinction Hackett’s research draws between isolated automation and process-led AI transformation — the latter is what produces the 52–59% cost reduction figures.
Translate the mechanism into KPIs you can actually track:
- Touchless rate — the percentage of transactions requiring zero manual intervention.
- Cost per invoice — fully loaded, from receipt to payment.
- DSO — a direct signal of how much faster cash application is converting receivables.
- Cycle time — invoice receipt to approval, and close to reporting.
None of these move overnight. Expect touchless rates to climb steadily over two to three quarters as exception-handling rules mature, not in a single step-change after go-live.
How to calculate ROI for finance automation
The formula recommended by the Corporate Finance Institute is straightforward:
ROI = ((Total quantified benefits − Total costs) / Total costs) × 100
The discipline is in what you put on each side of that equation. Skimping on either produces a number that looks good in a slide deck and falls apart under scrutiny from your audit committee.
Step 1: Gather baseline metrics. Transaction volume, current cost per transaction, error remediation cost, current DSO, and hours your team spends on manual processing. Without this, you have no “before” to measure against.
Step 2: Build a fully-loaded cost model. Include licence fees, integration work, data cleansing and remediation, change management, governance setup, and ongoing oversight. Practitioner analysis from HBS Online puts soft costs, remediation, integration, and change management, at two to three times the licence fee in year one. Leave those out and your ROI is fiction.
Step 3: Apply a realisation factor. Helperfy’s CFO guidance recommends modelling conservative, base, and optimistic scenarios rather than a single number, and treating vendor claims as the ceiling.
Worked example: a business processing 4,000 invoices a month at £8 fully-loaded cost per invoice spends £384,000 annually. Automation benchmarked at a 25% cost reduction (in line with Nasdaq’s reported Hackett figures) implies £96,000 in gross annual savings.
Pro Tip: Run all three scenarios side by side in the same board pack. A CFO who shows conservative, base, and optimistic figures together looks more credible than one who presents a single optimistic number, and it’s far easier to defend if year-one results land below plan.
What ROI metrics and benchmarks should you cite?
Boards want specific, named metrics, not vague claims of “efficiency”. Build your business case around these:
- Cost per transaction (invoice, payment, or reconciliation line).
- Touchless processing rate.
- Cycle time — receipt to approval, and close to reporting.
- Error rate and rework cost.
- DSO and days to close.
For external validation, three sources carry weight in board papers. Hackett’s benchmarks show 52–59% reductions in order-to-cash process costs among mature adopters. The same research cohort reported 25% lower invoice processing costs. APQC’s benchmarking framework gives you a standardised ROI measure to compare your own results against peer organisations.
Use these figures as ceilings, describing what best-in-class transformation achieves after full maturity, not as your year-one target. A conservative realisation factor of 60–80% against the benchmark keeps your business case defensible when the audit committee asks how you got there.
Why do finance automation projects fall short of their promised ROI?
Most ROI shortfalls trace back to the same handful of causes, and nearly all of them are preventable with better planning before go-live.
Underestimated data remediation and integration costs. Legacy chart-of-accounts structures, inconsistent supplier records, and non-standard file formats all need cleaning before automation can run reliably. This work routinely gets left out of the budget, then shows up as a costly surprise mid-project.
Skipping baselining. If you don’t measure cost per invoice, cycle time, and error rate before deployment, you have nothing credible to compare against after. Vendors will happily supply a benchmark figure; you need your own starting point.
Weak change management. Automation that finance staff route around, entering data manually “just to be safe”, delivers none of the modelled savings. Adoption tracking needs to be part of the rollout plan, not an afterthought.
Missing governance. Audit logs, model validation, drift monitoring, and clear escalation workflows should be built into deployment from day one. Corporate Finance Institute’s guidance treats this as a first-phase requirement precisely because retrofitting governance after problems surface is far more expensive than building it in upfront.
Pro Tip: Before signing any vendor contract, insist on KPIs written into the agreement, touchless rate targets, implementation timelines, support response times, not just a licence fee and a features list.
How does automation affect risk management and compliance costs?
Manual processes are where compliance risk concentrates. A finance team keying invoice data by hand introduces transcription errors, inconsistent approval trails, and gaps that make audits slower and more expensive. Automation addresses this directly by creating a consistent, timestamped audit trail for every transaction, exactly what auditors and regulators want to see.

Automated matching and reconciliation also reduce fraud exposure. Duplicate payments and unauthorised vendor changes are far easier to catch when a system flags anomalies automatically than when a human reviewer is skimming a spreadsheet at month-end under deadline pressure.
The compliance cost saving is real but easy to overstate. Fewer manual touchpoints mean fewer opportunities for error, and that shows up as lower remediation cost and faster audit cycles. It does not eliminate the need for oversight. Model validation, escalation workflows for flagged transactions, and periodic review of automation rules all need to remain in place, and budgeting for them is part of the fully-loaded cost model discussed earlier, not a separate line item you can skip.
What strategic value does automation deliver beyond cost savings?
Cost reduction gets automation projects approved. Scalability and better analytics are usually what makes finance leaders glad they did it.
A finance team running automated invoice capture and reconciliation can absorb transaction volume growth, more suppliers, more entities, higher invoice counts, without proportionally growing headcount. That’s a structural advantage a manually staffed team simply doesn’t have when the business scales.

The analytics benefit compounds over time. Once transaction data is captured cleanly and consistently rather than scattered across spreadsheets and email threads, finance can build real-time cash flow visibility and trend analysis that manual processes never supported. This is where longer-horizon use cases like FP&A and treasury forecasting start to pay off, distinct from the fast payback of transactional automation, and on a longer timeline, as broader CFO adoption research on generative AI use cases suggests.
The strategic case is simple: transactional automation funds itself in under a year, and the data infrastructure it builds becomes the foundation for the analytics work that’s harder to cost-justify on its own.
How do you measure intangible benefits like error reduction and staff satisfaction?
Not every benefit shows up as a line item, but that doesn’t mean it can’t be measured with reasonable rigour.
Error reduction impact is the easiest to quantify. Track error rate before and after deployment, then multiply the change by your average remediation cost per error (staff time plus any downstream cost, like a late payment penalty or a duplicate payment recovered). This converts a “fewer mistakes” claim into a defensible pound figure.
Employee satisfaction is harder but not impossible. A short survey before and after rollout, asking specifically about time spent on repetitive manual tasks and confidence in data accuracy, gives you a comparable before-and-after signal. Pair it with a retention or internal mobility metric over 12 months; finance teams freed from repetitive keying tend to redeploy toward analysis work, which shows up in role changes and reduced turnover in transactional positions.
Present both alongside your lagging cost-per-invoice figure, not instead of it. Boards respond better to a business case that shows leading indicators (touchless rate climbing, survey sentiment improving) next to the lagging ROI number, because it demonstrates the trend is sustainable rather than a one-off saving.
Does ERP integration change how fast you see ROI?
Integration complexity is the single biggest variable in how quickly ROI materialises, and it’s the one CFOs most often underestimate at the proposal stage.
A business running a single, modern cloud ERP with clean API access can typically connect automation tools within weeks. A business running multiple legacy systems, manual exports, or heavily customised ERP instances should expect integration and data remediation to take considerably longer, and to cost more than the licence fee itself, in line with the two to three times multiplier noted earlier from HBS Online’s cost analysis.
This is why baselining your systems landscape matters as much as baselining your metrics. Before you commit to a payback timeline in a board paper, map out exactly which systems need to talk to each other, and where you’ll need a bank feed, an email integration, or a Google Sheets sync running live rather than a manual export. A finance tool that connects directly to your bank and email, rather than requiring a heavy middleware build, shortens the integration phase considerably and pulls your payback date forward. That timing difference alone can be the gap between a nine-month payback and an eighteen-month one.
What the ROI conversation gets wrong
Most ROI pitches for finance automation lean too hard on the benchmark ceiling and too lightly on the cost floor. Vendors quote Hackett’s 52–59% figures because they’re genuinely achievable, but they’re achieved by organisations several years into process-led transformation, not by a business three months post-implementation. The conventional advice tells CFOs to build a business case around the benchmark. The better advice is to build it around your own baseline, then use the benchmark only to sanity-check whether your assumptions are realistic.
Where most guidance falls short is treating ROI as a single number rather than a portfolio decision. Transactional automation, invoicing, cash application, reconciliation, pays back fast and predictably. FP&A and forecasting tools pay back slower and less predictably, because the value depends on decisions made with better data, not on removing manual effort directly. Conflating the two in one ROI figure is how business cases lose credibility with a sceptical finance committee.
If you take one thing from this, prioritise the baseline over the benchmark. A defensible cost-per-invoice figure from your own books, measured before you touch anything, is worth more in a board meeting than any percentage a vendor’s case study can offer.
— Gašper
How Zenith-books can help you build the case
If your ROI plan starts with accounts payable or cash application, Zenith-books is built for exactly that starting point. Its AI invoice extraction, bank sync, and automated matching remove the manual keying and reconciliation work that drives most of the cost-per-invoice figure in your baseline calculation.
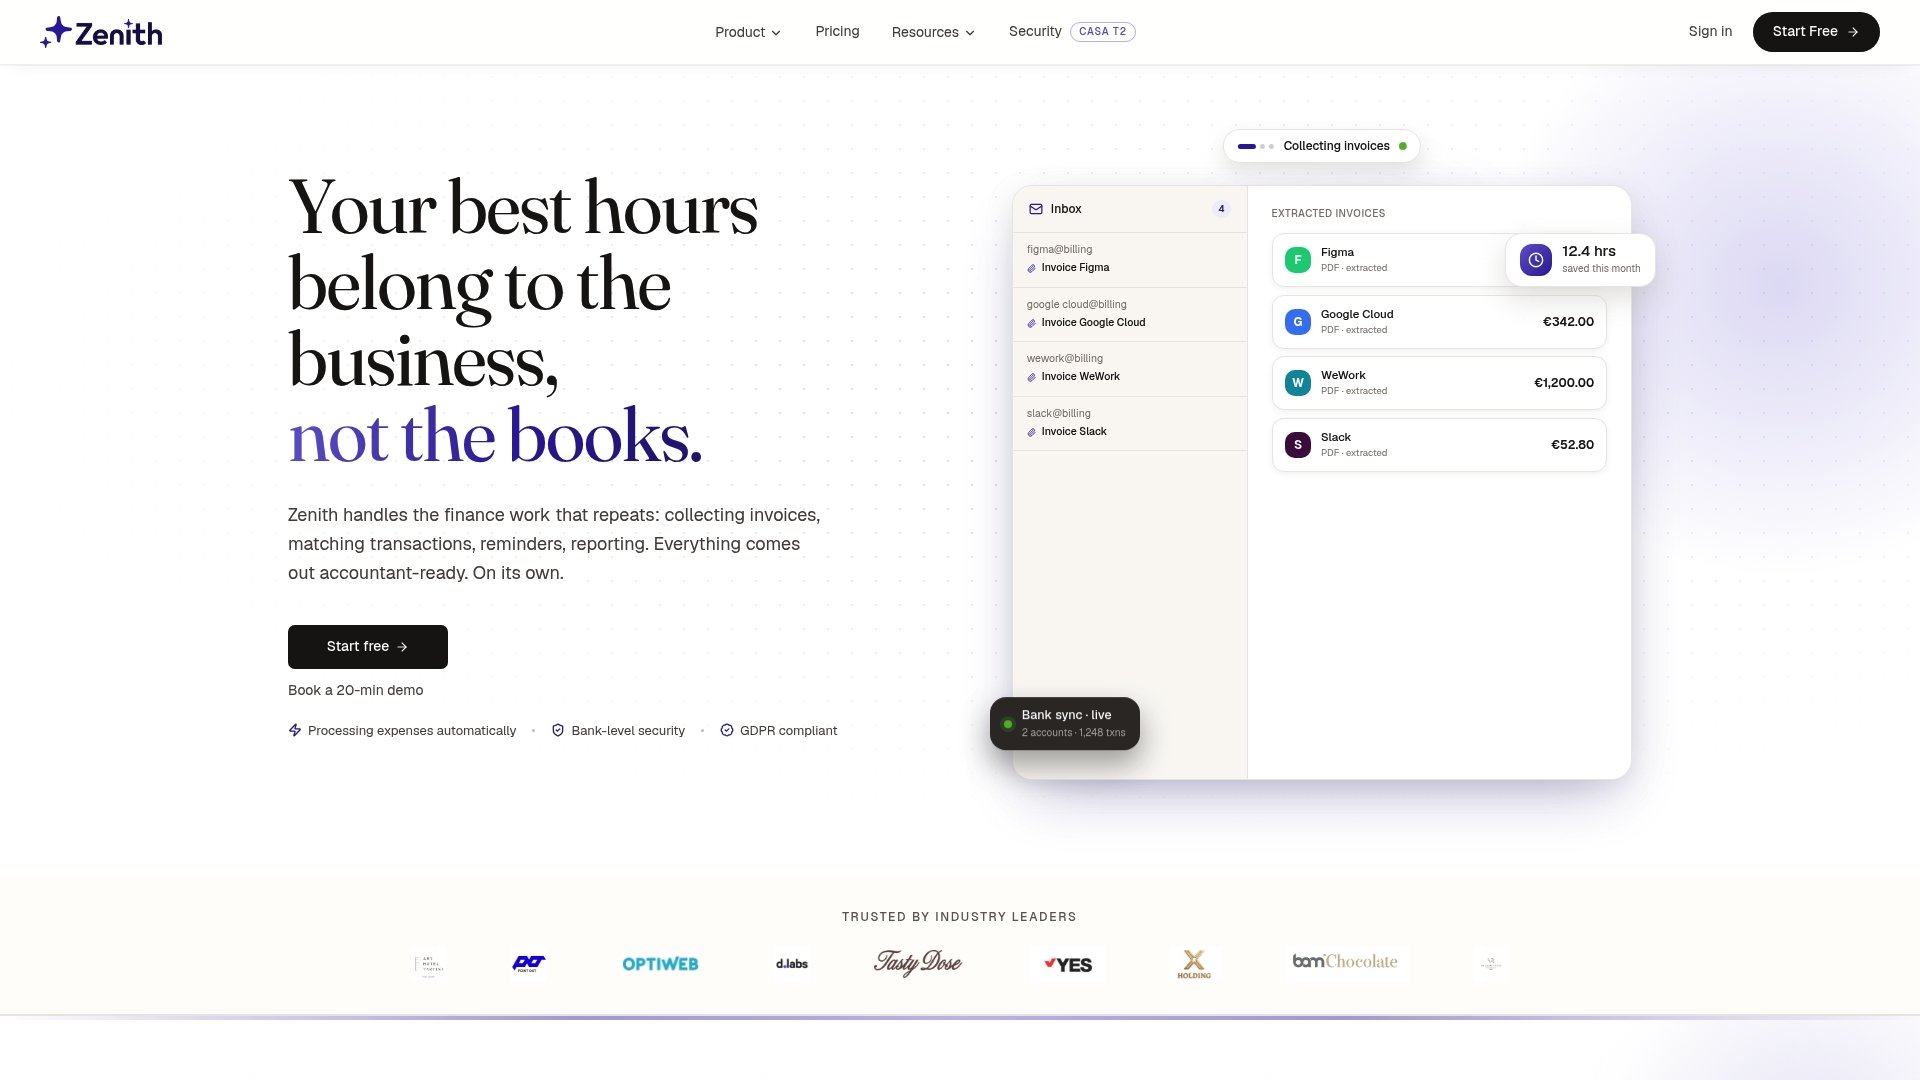
A sensible pilot scope: run Zenith-books against one entity’s AP process for a full quarter, tracking cost per invoice, touchless rate, and cycle time against your pre-deployment baseline. Clients including Združenje YES and BAM Chocolate have reported substantial time savings and faster month-end close using this same approach, with zero manual entry across transactions once the workflow was live. If you’re weighing up how invoice capture routes into Google Drive fits your existing filing structure, that’s a natural first module to test. Book a demo to see how the setup maps to your own baseline numbers before you commit to a full rollout.
Sources
- The Hackett Group® establishes AI World Class finance benchmarks
- Hackett Group establishes AI World Class finance benchmarks (Nasdaq press release)
- ROI of Implementing AI Agents in Finance - Formulas & Benchmarks
- ROI achieved with finance process automation (APQC)